A case study of complex table design
I just released a new version of Actual and a big change is a rewrite of the budget table. It might not look like much, but it pays down a lot of technical debt and is a big improvement in many ways. The previous design resulted in a poor user experience despite good intentions. This is a look at how I approach product design and all the considerations you need to think about.
First, the before (left) and after (right):
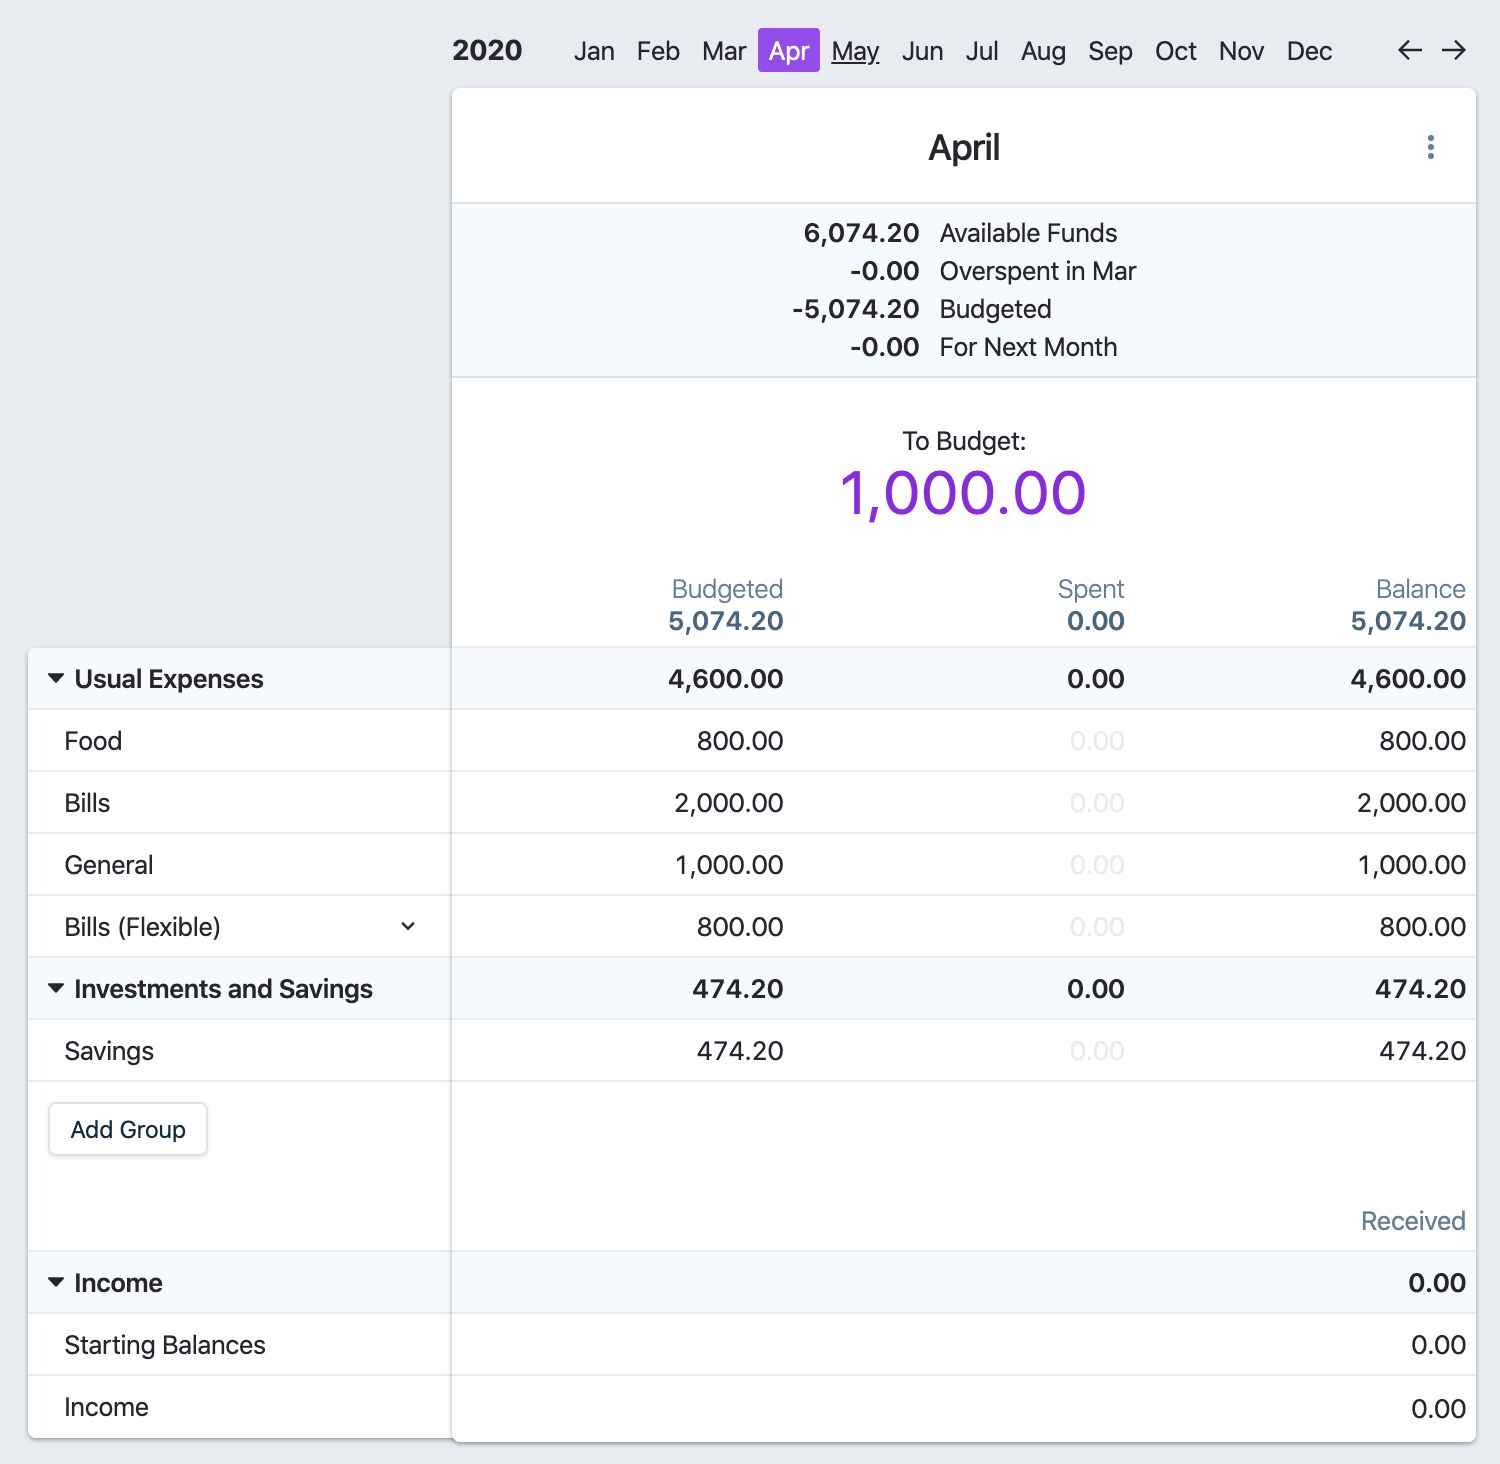
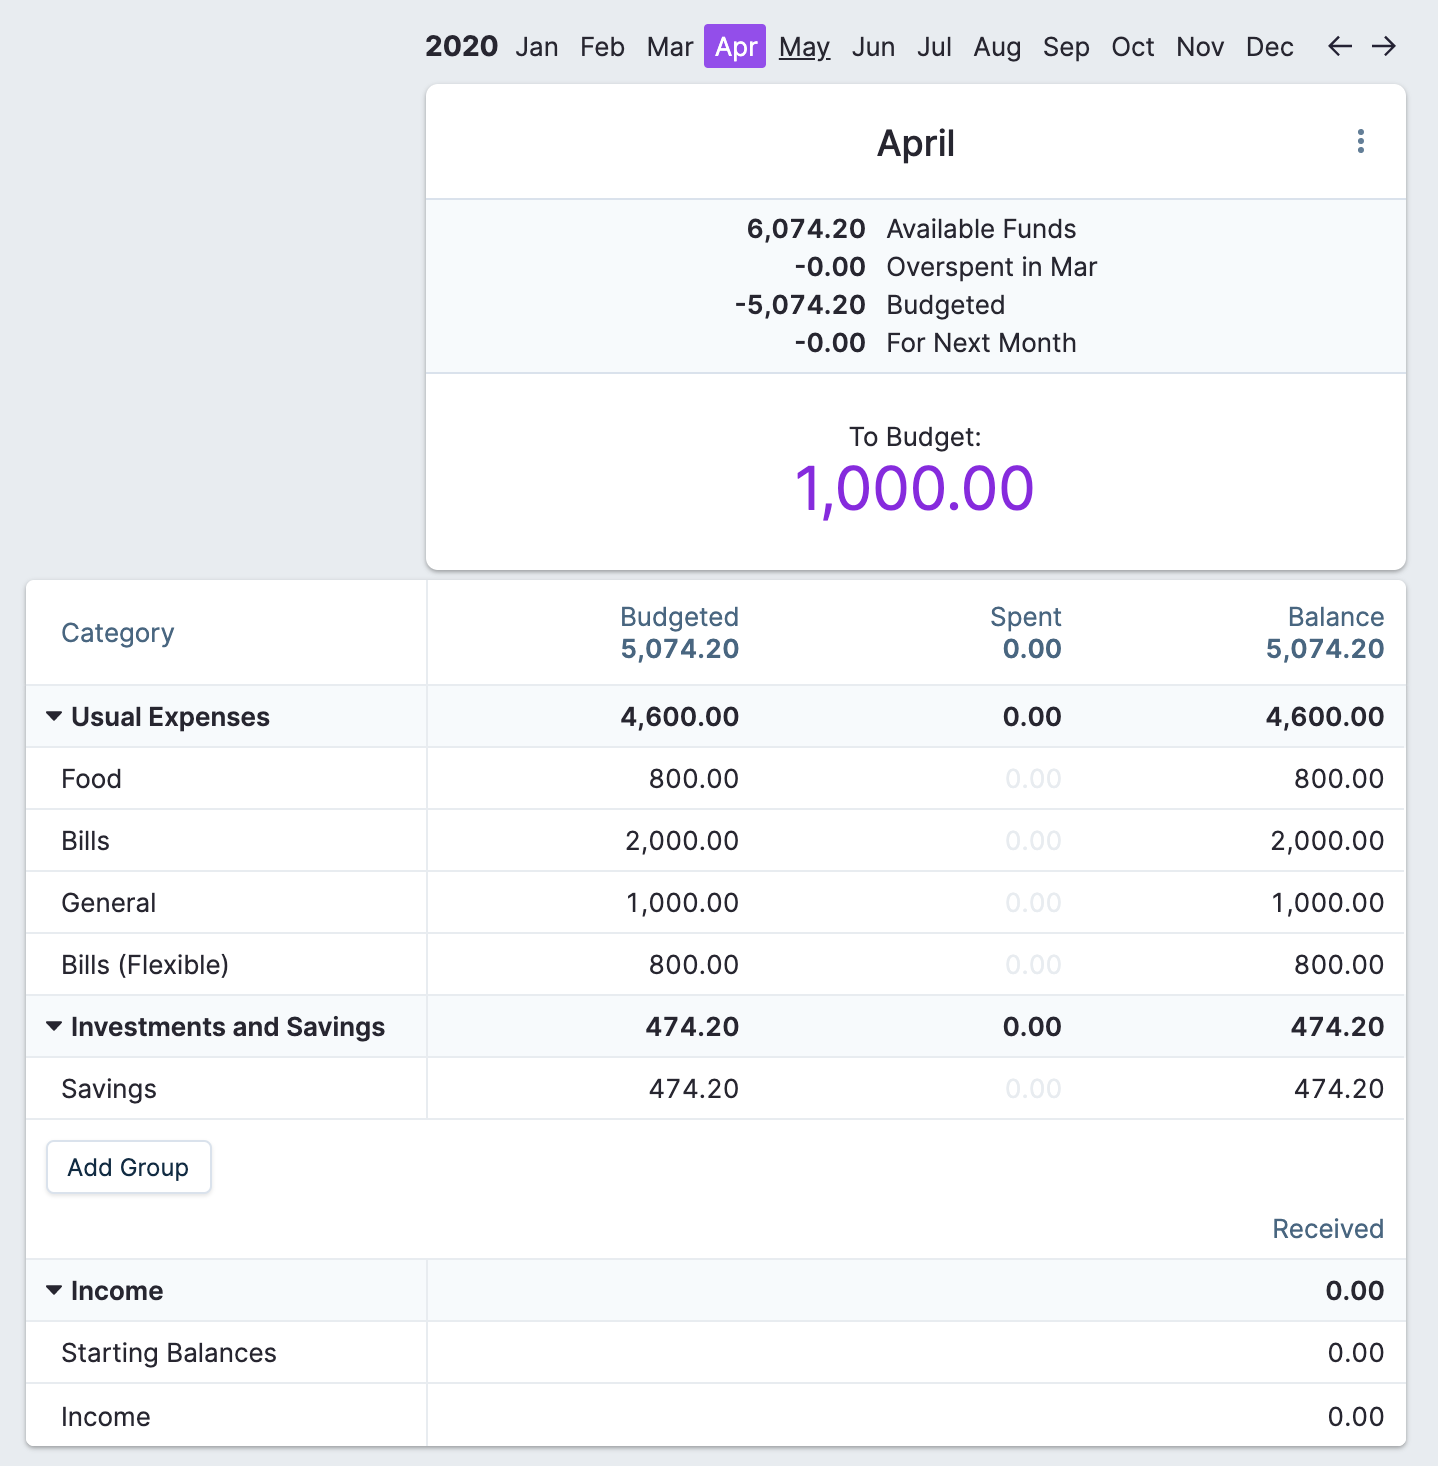
On the surface, it's a very subtle change. The headers are now attached to the table and the summary section at the top is separated into its own space. There's another subtle change — can you guess what it is?
It might be hard to see in the small screenshots, the default font has changed to Inter from the default system font like San Francisco on Mac. San Francisco is a great font, but it's only available on Macs and it not as readable for data. Inter is a beautiful font made for readability — even when your using the fixed-width feature setting for stuff like transaction amounts.
Here's a closeup of the difference. Before with San Francisco (top) and after with Inter (bottom):
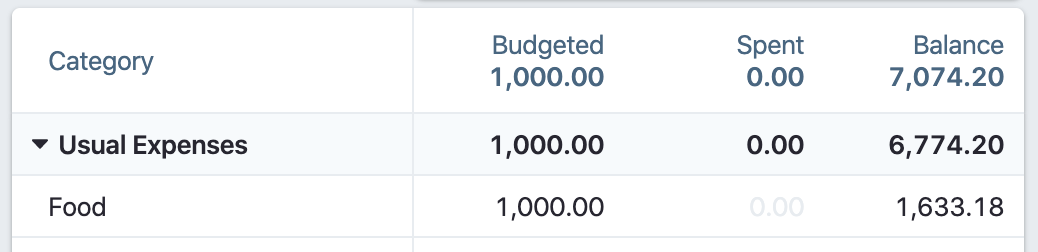
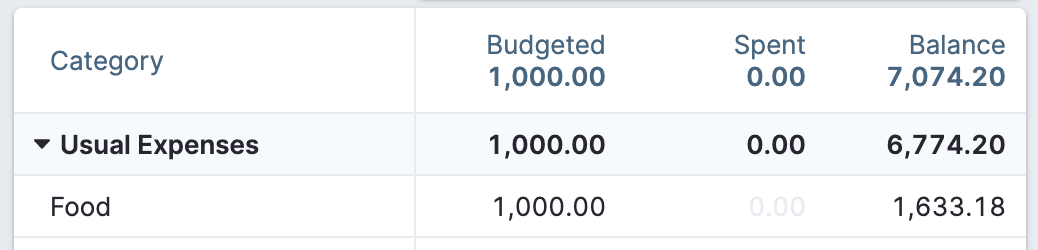
They look remarkably similar, but a few small differences make a big impact. The font is slightly taller which helps with readabilty, and the characters aren't quite a squished together. Look at the 1,000.00 amount: with San Francisco (left) the zeros almost bleed together while Inter (right) provides just enough spacing to make them clear.
There is one major difference in the new design: animations. In the old design, the month was treated as one whole column including the summary and budget values for the month. This was driven home with an animation that slid the entire month column when moving across months:
The purpose was to give visual feedback. Without it, it's hard to tell that months actually moved, especially if most of the numbers are the same. It gets worse when you are viewing multiple months at once, a feature that's great for getting a glance at a longer time period at once. Here's an example of multiple months:
The animation is smooth in reality (the video is low-quality). Compare this to no animation:
When the budget values haven't changed, the only thing changing is the month name at the top. I didn't want the feedback to be dependant on having enough different data. However, there's no arguing that the second video is superior for a few reasons:
- It's faster. The user can see new data immediately without waiting for the animation to finish.
- The user can compare data easier. They can keep their eye on the "balance" value for a category while navigating across months and easily see it change. With the animation, it's hard to keep track of the values since they move around.
I didn't want to completely give up the visual feedback though. The new design is a compromise that is a much better balance between usability and user experience:
Now the budget table stays fixed while the summary sections animate. This makes it a much more lightweight interaction and feels a lot nicer. A huge benefit is that the implementation is far simpler as well. The previous animation wreaked havoc on the DOM structure. Let me explain.
The problem is the table needs to be scrollable as well. When the user has lots of categories, they need to scroll up and down. So the table can be moved both horizontally and vertically:
We want to use native scrolling, of course, which means we have to put the whole budget table in it's own vertically scrollable container. There's no way around that. In order to slide the months around horizontally, we render the summary views outside of the scrollable area, and inside it each month is rendered as a column. The entire animation looks like this. The purple area is the scrollable container that content is rendered inside of:
I was really proud of getting this to work. I still am! The problem is this is a terrible way to renders rows of data. Normally you expect a row of data to be inside a single container which makes a lot of stuff easy. Originally I thought it was worth the sacrifice for a better user experience, but turns out it's not even a great user experience.
Why is it a terrible way to render rows? Take a closer look at the structure of the DOM we're focused to use. Each column renders a list of data inside of it:
Since a row is composed of multiple disconnected elements, it's impossible to do simple things like a background color on hover. Only each piece of the row will get the hover state. Suddenly .row:hover { background-color: #f0f0f0 } becomes an extraordinary feat of tracking hover state in React and constantly rerendering.
Even worse, it thrashes rendering whenever anything changes. When rendering lists of data, normally you can memoize each row and bail on rendering if nothing changes, only causing one row to rerender if something like a category name changes. You can apply the same technique to the above layout, but it needs to do it for every column (in the above example there are 3 columns so there are 3 times as many memoization checks).
Since the budget table is static in the new design, each row is rendered how you would expect: each row is inside a div. Animating the summaries is easy because there are no scrolling requirements. Take a look again at the new design:
I spent too much damn time working on the old design that isn't even good user experience that I really wish I had taken a step back sooner. At least I have something to write about.
Better drag-and-drop
Another example of how much simpler the new layout makes everything is drag-and-drop. You can drag categories in the sidebar to reorder them. Previously, it was impossible to render anything across the entire budget table since you're only dragging inside of the sidebar. Here's what it looked like before:
Note how the budget table grays out when you start dragging. That was the only thing I could think of since I can't actually move anything outside the sidebar around. There's also weird behavior when expanding a group: the table doesn't expand with it.
Here's the new implementation. While it doesn't beautifully slide content around, it's much more crisp and clear. The blue line renders across the entire budget table, expanding and collapsing groups works with all the data as well, and it's just better:
Other improvements
This work led to a couple other small improvements. You can now collapse the summary view if you want more space for the categories. Combined with the multiple month view, you can really get a nice condensed view of your budget:
Because the new layout is so much more performant, the maximum number of months viewed at once has been bumped up to 6 from 4. Just look at this beautiful monster:
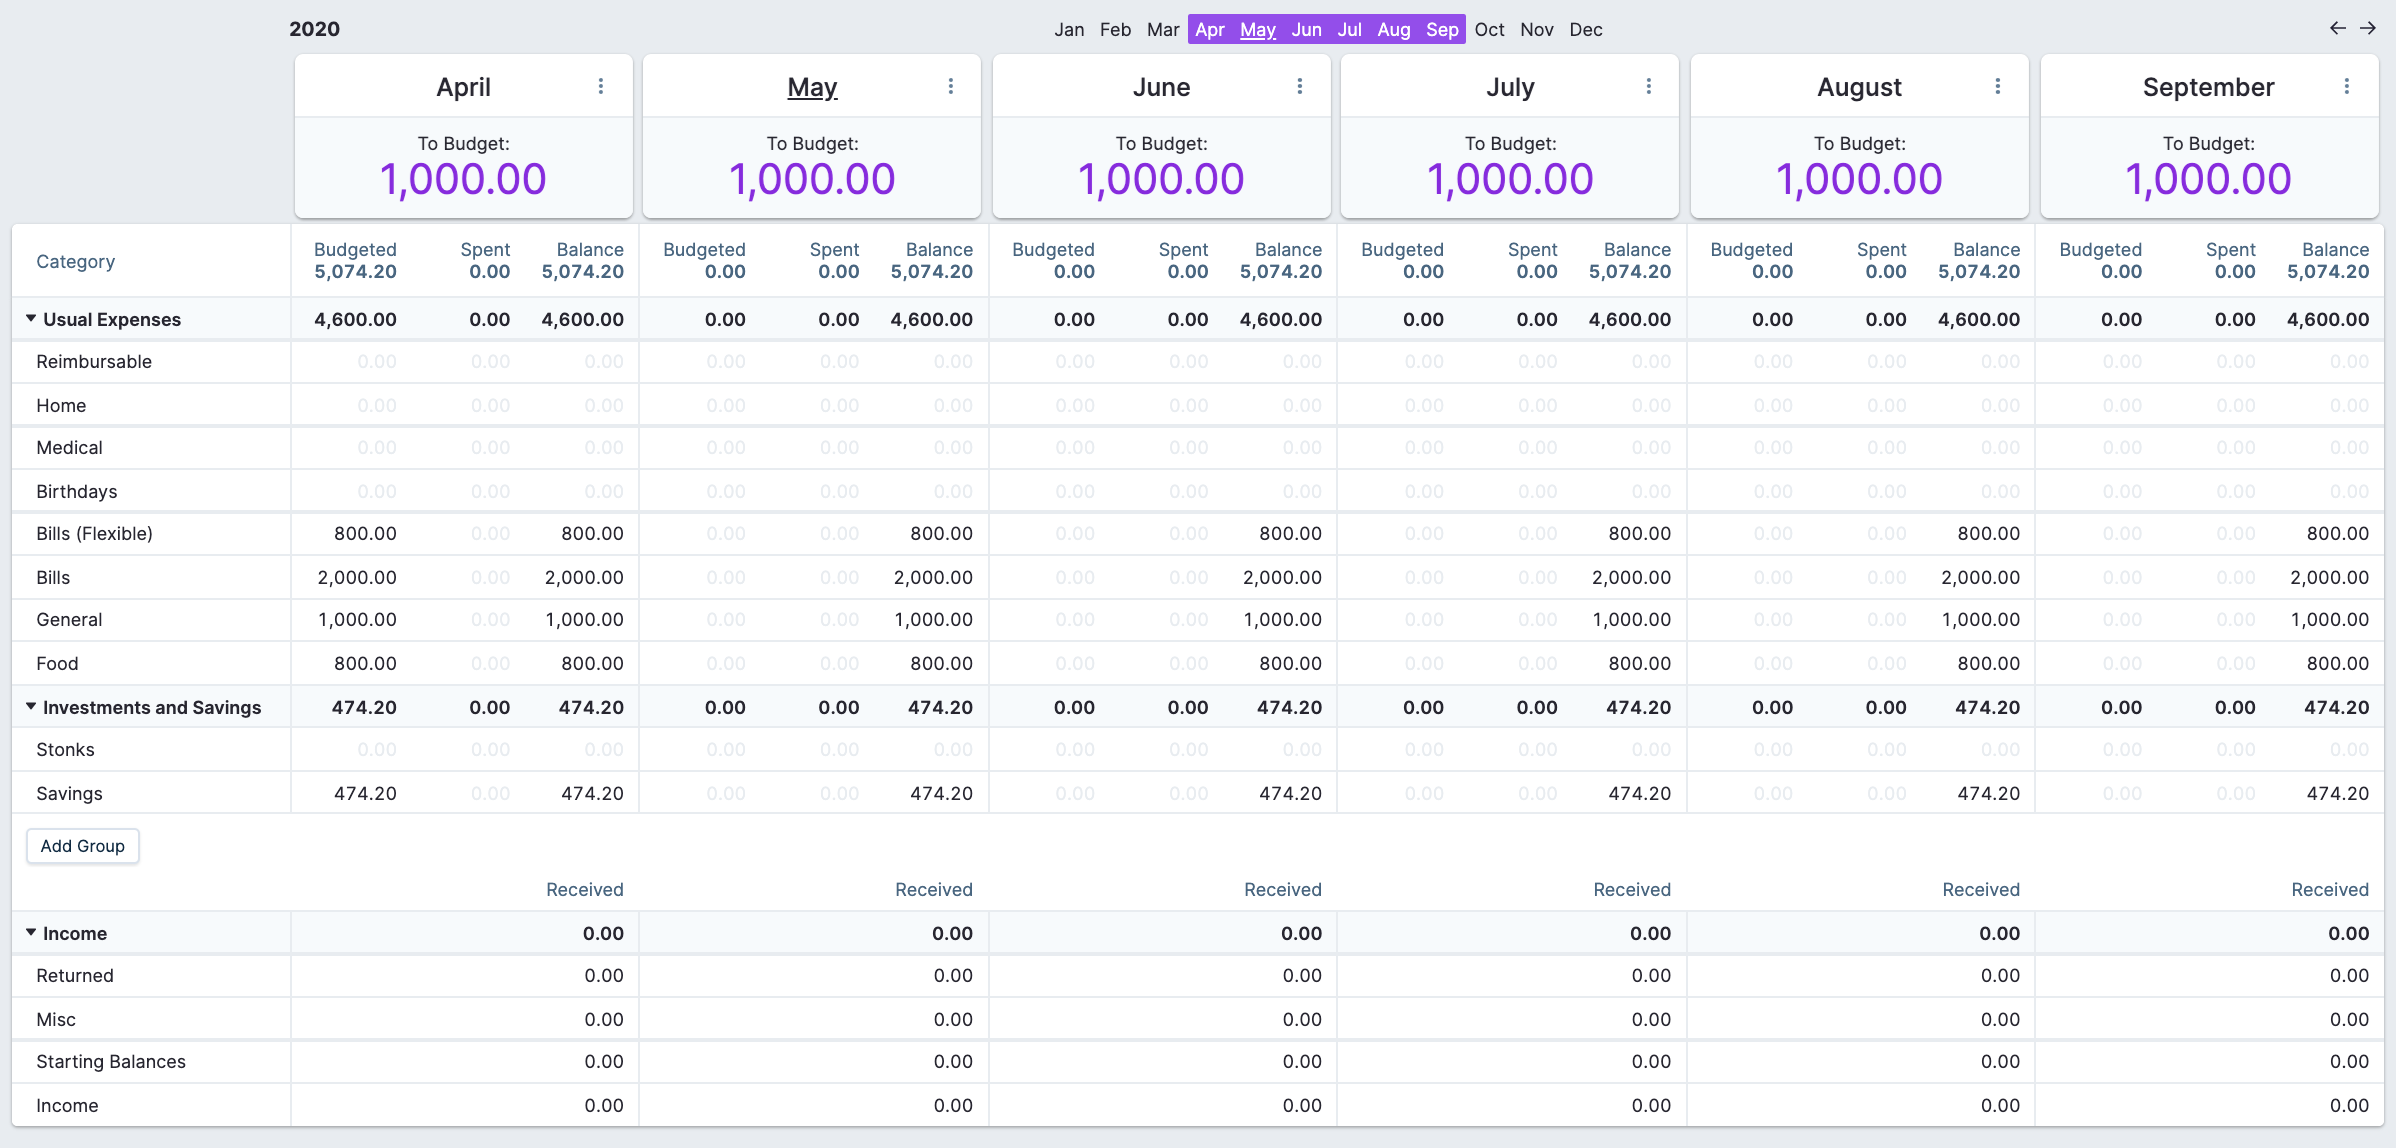
Ignore the inconsistent widths of the row borders, I had to zoom out to fit all of this which causes a few glitches.
This release includes a lot of other changes like the ability to attach notes to categories and months. Check out the release notes, and you can always try a demo of the app.