On the Road to Better Sourcemaps in the Firefox Developer Tools
In the last couple of years, module bundlers have taken off in the JavaScript tooling world. And for good reason: programming with <script> tags is a terrible way to write software, and a build step offers a lot of opportunity for optimizations and transformations (like ES6->ES5). Alternative languages that compile to JS, like ClojureScript and Elm, have also taken off.
The main problem with a build step is the debugging experience: you are no longer debugging the source code that you wrote. Sourcemaps were created to solve this problem, and allow compilers to annotate generated JavaScript with information about how locations map back to the original code.
Sourcemaps aren’t that complicated. What is complicated is making sure every place in the devtools that uses location information consults any available sourcemaps. From personal experience, let me tell you that it's quite complicated.
We support sourcemaps in the debugger, and that means we will list the original sources and allow you to browse ClojureScript files if that’s what you wrote. You can also set breakpoints on them, and we will (hopefully) translate all this information to a real JavaScript source that we can set breakpoints on. Getting this right is really hard, and we are working on making it better.
Console
Unfortunately, so far we do not support sourcemaps in any other tools. The biggest pain point is the console: you won’t see sourcemapped line numbers in anything logged there.
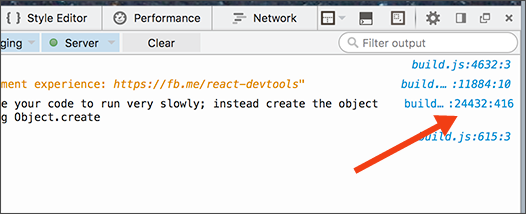
We’ve done some amazing things with the Firefox DevTools, but this is one of those things where I keep thinking, “none of this matters if we still don’t sourcemap the console!” (Not true, of course.) We know this is a common pain point, and we’ve had a bug on file for years.
I decided to look into this about a year ago, and got pulled into a deep rabbit hole. But there is good news: we just landed the major architectural piece required for getting the console sourcemapped (these changes will be in Firefox 46). It’s not actually using sourcemaps yet, but it has access to them now.
Unobtrusive Debug Mode
What was so hard about this? Can’t we just expose the sourceMapURL for a URL and make the console fetch and use it?
We can’t, of course. What about sources created by eval? They have no URL. We really want to go through the debugger to get sourcemaps so they work robustly.
JavaScript sources are annotated with a special comment to link to a sourcemap: //# sourceMappingURL=build.js.map. This is exposed in our Debugger APIs; once you connect a debugger to the page, you can get at this debug information.
This presents a problem: connecting a debugger to the page potentially alters how it performs. In an ideal world, debug mode should have zero cost unless you need it (like pausing on a debugger statement). But it’s really hard to make it work unobtrusively. JavaScript engines are already complex; imagine taking a jet engine and adding the requirement that it should be able to stop immediately without slowing down at all.
This is why, up until now, we didn’t actually connect the debugger until you click the “Debugger” tab to open it. We didn’t want to affect performance if you were just using the console, but that means the console didn’t have access to sourcemaps. We were stuck because connecting the debugger had terrible consequences.
Let me explain why it’s so hard to make the debugger unobtrusive. Imagine you have the following code:
function foo() {
  return 5;
}

function bar() {
  return foo() + 1;
}

function baz() {
  return 6;
}
This is extremely simple code because the code doesn’t matter. What matters is that we have 3 functions, with bar calling foo. Like any JavaScript engine, SpiderMonkey has multiple tiers for running code: interpreted, baseline, and Ion, going from low to high performance. Ion is the level where we've generated highly-optimized assembly code, so it’s by far the fastest. Here’s what happens when we call these functions a lot and they get promoted to Ion:
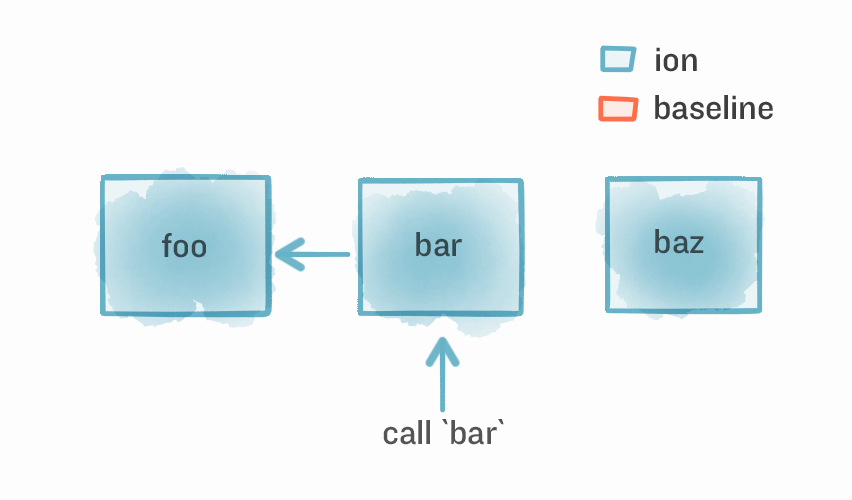
We show the state of the system when we call bar, which will be important in a second. bar calls foo, and everything has been promoted to Ion.
Now we attach a debugger to the page. Here’s what happens:
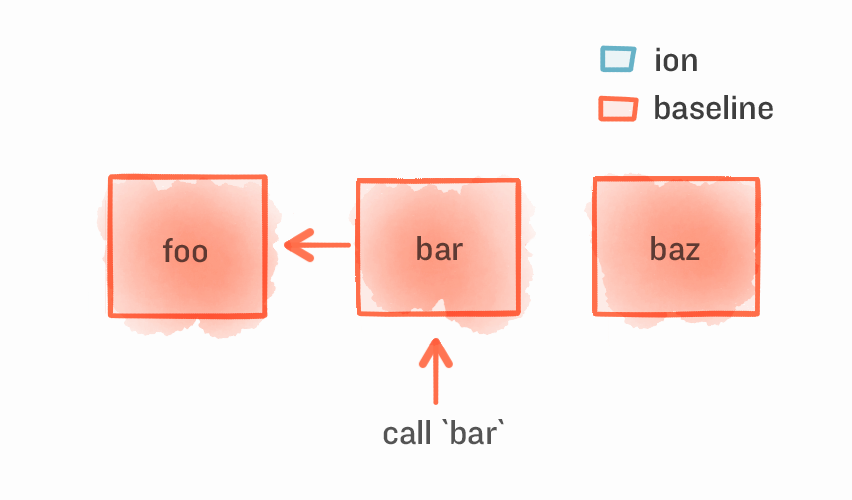
All functions have been demoted to baseline, no matter what. This means the entire page takes a significant performance hit, especially something intensive like games.
The reason we did this is because we don’t support the debug hooks for pausing and inspecting functions in Ion. When you set a breakpoint, the JS engine needs to trigger the debugger and be able to give it all kinds of information like variables in scope. Information that is not available in Ion.
How in the world can we support high-performance code with Ion but have the debuggability of baseline? The answer is on-stack deoptimization, and luckily my colleague Shu-yu was already thinking about this last spring. He did some amazing work and wrote about it in a blog post, which you should totally read even if you don’t understand it. It’s seriously amazing stuff.
After a lot of work, he landed it last May (see bug). The means that we can connect a debugger and keep all functions in Ion! I honestly think this was some of the most important work for devtools usability.
So what does our example look like now? Here’s our page with a debugger connected:

All functions stayed in Ion! Now, let’s set a breakpoint in foo so the debugger pauses inside it. What does it look like now?
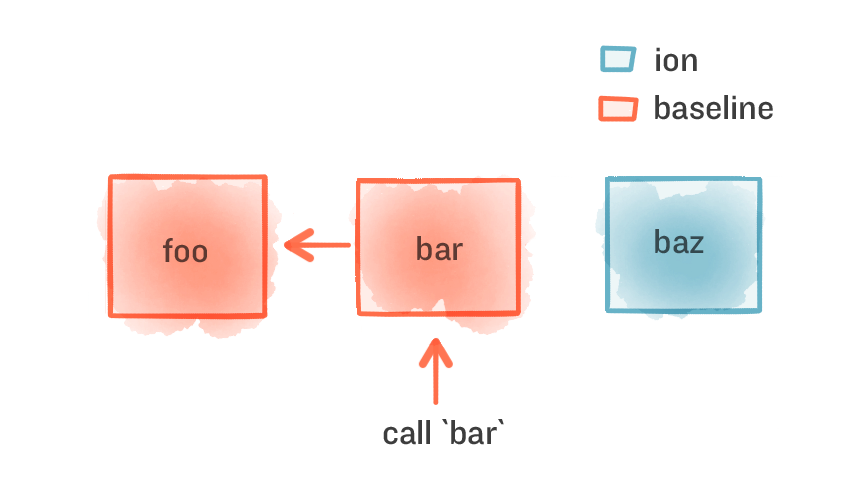
It de-optimizes foo to baseline, which wouldn’t be too hard to do when we set the breakpoint. The hard part is bar, because bar is on the stack and in Ion when it calls foo, but it still de-optimizes bar to baseline when it’s on the stack. Crazy stuff.
The end result is that the majority of your functions will stay in Ion, and only the ones that need to be de-optimized will be. This means that we can freely connect the debugger immediately when the devtools open, which is exactly what the bug I just landed does.
More Consistent
Last week I finally landed bug 1132501 which connects the debugger on startup, always. It still took me a while to land this because it exposed lots of bugs in various tests since every devtools test is now running with the debugger enabled, but we finally got it.
Now that the debugger is connected immediately when devtools opens, everything is more consistent. Allowing other tools to access sourcemaps is a big win, but there are other benefits as well.
Certain behaviors in the devtools change when the debugger is connected, so it would act differently depending on if you’ve clicked on “Debugger” or not. One of the biggest things is breaking on debugger statements. Previously, debugger statements would be ignored if you had the devtools open, but hadn’t clicked on “Debugger” yet. This is a huge “WAT?!”
That is now fixed. Here you can see a fresh instance of the tools, and calling a function from the console that invokes the debugger statement. It properly pauses and jumps to the debugger:

Other minor behaviors include clicking on a function in the console will jump to the source in the debugger.
We will be working on integrating sourcemaps into other tools now, especially the console. It shouldn’t be too much work now. I hope this has explained the technical difficulty underlying all of this work, and why it took us a while to finish it.
Enjoy your stop-on-a-dime jet engine.
 JAMES LONG